CHAPTER 6
Specific Heat Patterns
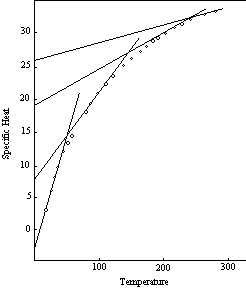
Figure 5 is a specific heat curve derived from experimental data. The points shown in this graph are the measured values of the specific heat of silver. The accompanying solid lines are the segments of the theoretical four-unit curve of Figure 4 with the temperature scale located empirically. While the curve defined by the plotted points has the same general shape as the theoretical curve, it is quite different in appearance inasmuch as the sharp angles of the theoretical curve have been replaced by smooth and gradual transitions.
The explanation of this difference lies in the manner in which the measurements are made. As indicated by equation 5-8 and the curves in Figures 3 and 4, the specific heat of an individual molecule can be represented by a succession of straight lines. Experimental observations, however, are not made on single molecules, but on aggregates of molecules, and the observed temperature of the aggregate is the average of many different individual molecular temperatures, which are distributed about the average in accordance with the probability relations. Midway between the transition points the relation between temperature and specific heat for most of the individual molecules is such that their specific heats lie on the same straight line in the diagram. The average consequently lies on the same line, and coincides with the true molecular specific heat corresponding to the average temperature. In the neighborhood of a transition point, however, the molecules that are individually at the higher temperatures cannot continue on the same line beyond the 3R limit, and must conform to a lower curve based on a higher number of rotating units. This operates to reduce the specific heat of the aggregate below the true molecular value for the prevailing average temperature.
In the silver curve, Figure 5, for example, the true atomic specific heat at 75° K is 4.69. This would also be the average specific heat of the silver aggregate at that temperature if the silver atoms were able to continue vibrating on the basis of one rotating unit up to the point beyond which the probability distribution is negligible. But at a specific heat of 21/3 R (4.633) the vibration changes to the two-unit basis. Those atoms in the probability distribution that have specific heats above this level cannot conform to the one-unit line but must follow a line that rises at a much slower rate. The lower specific heat of these atoms reduces the average specific heat of the aggregate, and causes the aggregate curve to diverge more and more from the straight line relation as the proportion of atoms reaching the transition point increases. The divergence reaches a maximum at the transition temperature, after which the specific heat of the aggregate gradually approaches the upper atomic curve. Because of this divergence of the measured (aggregate) specific heats from the values applicable to the individual atoms the specific heat of silver at 75° K is 4.10 instead of 4.69.
Figure 5: Specific Heat-Silver
A similar effect in the opposite direction can be seen at the lower end of the silver curve. Here the specific heat of the aggregate (the average of the individual values) could stay on the one-unit theoretical curve only if it were possible for the individual specific heats to fall below zero. But there is no negative thermal energy, and the atoms which are individually at temperatures below the point where the curve intersects the zero specific heat level all have zero thermal energy and zero specific heat. Thus there is no negative deviation from the average, and the positive deviation due to the presence of atoms with individual temperatures above zero constitutes the specific heat of the aggregate. The specific heat of a silver atom at 15° K is zero, but the measured specific heat of a silver aggregate at an average temperature of 15° K is 0.163.
Evaluation of the deviations from the linear relationship in these transitional regions involves the application of probability mathematics, the validity of which was assumed as a part of the Second Fundamental Postulate of the Reciprocal System. For reasons previously explained, a full treatment of the probability aspects of the phenomena now under discussion is beyond the scope of this work, but a general consideration of the situation will enable us to arrive at some qualitative conclusions which will be adequate for present purposes.
At the present stage of development of probability theory there are a number of probability functions in general use, each of which seems to have advantages for certain applications. For the purpose of this work the appropriate function is one that expresses the results of pure chance without modification by any other factor. Such a function is strictly applicable only where the units involved are all exactly alike, the distribution is perfectly random, the units are infinitely small, the variability is continuous, and the size of the group is infinitely large. The ordinary classes of events around which most present-day probability theory has been constructed, such as coin and dice experiments, obviously fail to meet these requirements by a wide margin. Coins, for instance, are not continuously variable with an infinite number of possible states. They have only two states, heads and tails. This means that a major item of uncertainty has become almost a certainty, and the shape of the probability distribution curve has been altered accordingly. Strictly speaking, it is no longer a true probability curve, but a combination curve of probability and knowledge.
The basic physical phenomena do conform closely to the requirements of a system in which the laws of pure chance are valid. The units are nearly uniform, the distribution is random, the variability is continuous, or nearly continuous, and the size of the group, although not infinite, is extremely large. If any of the probability functions in general use can qualify as representing pure chance the most likely prospect is the so-called “normal” probability function, which can be expressed as:
| y = ( 1 / √2π) e-x²/2 |
Tables of this function and its integral to fifteen decimal places are available.6 It has been found in the course of this work that sufficient accuracy for present purposes can be attained by calculating probabilities on the basis of this expression, and it has therefore been utilized in all of the probability applications discussed herein, without necessarily assuming the absolute accuracy of this function in these applications, or denying the existence of more accurate alternatives. For example, Maxwell’s asymmetric probability distribution is presumably accurate in the applications for which it was devised (a point that has not yet been examined in the context of the Reciprocal System), and it may also apply to some of the phenomena discussed in this work. However, the results thus far obtained, particularly in application to the liquid properties, favor the normal function. In any event it is clear that if any error is introduced by utilizing the normal function it is not large enough to be significant in this first general treatment of the subject matter.
On the foregoing basis, the distribution of molecules with different individual temperatures takes the form of a probability function φt, where t is the deviation from the average temperature. The contribution of the φt molecules at any specified temperature to the deviation of the specific heat from the theoretical value corresponding to the average temperature depends not only on the number of these molecules but also on the magnitude of the specific heat deviation attributable to each molecule; that is, the difference between the specific heat of the molecule and that of a molecule at the average temperature of the aggregate. Since the specific heat segment from which the deviation takes place is linear, this deviation is proportional to the temperature difference t, and may be represented as kt. The total deviation due to the φt molecules at temperature t is then ktφt, and the sum of all deviations in one direction (positive or negative) may be obtained by integration.
It is quite evident that the deviations of the experimental specific heat curves from the theoretical straight lines, both at the zero level and at the transition point have the general characteristics of the probability curves. However, the experimental values are not accurate enough, particularly in the temperature range of the lower transition, to make it worth while to attempt any quantitative correlations between the theoretical and experimental results. Furthermore, there is still some theoretical uncertainty with respect to the proper application of the probability function that prevents specifying the exact location of the probability curve.
The uncertain element in the situation is the magnitude of the probability unit. Equation 6-1 is complete mathematically, but in order to apply it, or any of its derivatives, to any physical situation it is necessary to ascertain the physical unit corresponding to the mathematical unit. One pertinent question still lacking a definite answer is whether this probability unit is the same for all substances. If so, the lower portion of the curve, when reduced to a common temperature base, should be the same for all substances with the -1.32 initial level. On this basis, the specific heat of the aggregate at the temperature T0, where the theoretical curve intersects the zero axis, should be a constant. Actually, most of the elements with the -1.32 initial level do have a measured specific heat in the neighborhood of 0.20 at this point, but a few others show substantial deviations from this value. It is not yet clear whether this is a result of variability in the probability unit, or reflects inaccuracies in the experimental values.
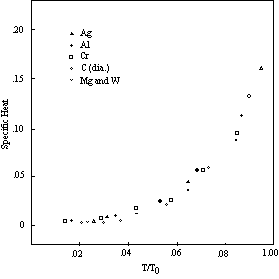
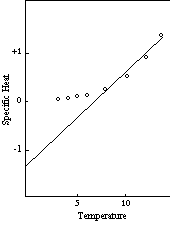
Whether all of the curves with the same maximum deviation (0.20) are coincident below T0 is likewise still somewhat uncertain. There is a greater spread in the observed specific heats below 0.20 than can be ascribed to errors in measurement, but most of the scatter can probably be explained as the result of lack of thermal equilibrium. At these low temperatures it no doubt takes a long time to establish equilibrium, and even an accurate measurement will not produce the correct result unless the aggregate is in thermal equilibrium. It is significant that the specific heats of the common elements which have been studied most extensively deviate only slightly from a smooth curve in this low temperature region. Figure 6, which shows the measured values of the specific heats of six of these elements on a temperature scale relative to T0, demonstrates this coincidence.
If the probability unit is the same for all, or most, of the elements, as these data suggest, the deviation of the experimental curve from the theoretical curve for the single atom at the first transition point, T1, should also have a constant value. Preliminary examination of the curves of the elements that follow the regular pattern indicates that the values of this deviation actually do lie within a range extending from about 0.55 to about 0.70. Considerable additional work will be required before these curves can be defined accurately enough to determine whether these is complete coincidence, but present indications are that the deviation at T1 is, in fact, a constant for all of the regular elements, and is in the neighborhood of three times the deviation at T0.
Figure 6: Specific Heat-Low Temperatures
With the benefit of the foregoing information as to the general nature of the deviations from the theoretical curves of Chapter 5 due to the manner in which the measurements are made, we are now prepared to examine the correlation between the theoretical curves and the measured specific heats. In order to arrive at a complete definition of the specific heat of a substance it is not only necessary to establish the shapes of the specific heat curves, the objective at which most of the foregoing discussion is aimed, but also to define the temperature scale of each curve. Although the theoretical conclusions with respect to these two theoretical aspects of the specific heat situation, like all other conclusions in this work, are derived by developing the consequences of the fundamental postulates of the Reciprocal System of theory, they are necessarily reached by two different lines of theoretical development. For this reason a more meaningful comparison with the experimental data can be presented if we deal with these two aspects independently. In this chapter, therefore, the experimental values will be compared graphically with theoretical curves in which the temperature scales are empirical. Chapter 7 will complete the definition of the curves be deriving the relevant temperature magnitudes.
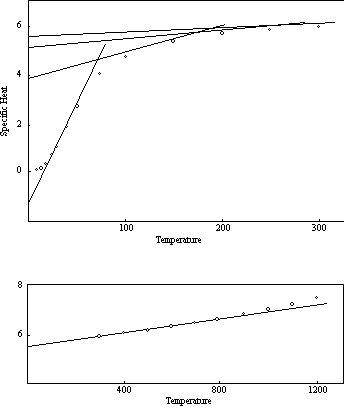
The curves of Figure 7 are typical of those of most of the elements.7 As indicated in Figure 4, the final straight line segment of each curve occupies the greater part of the temperature range of the solid state in the case of the high melting point elements. The significant features of the curves are therefore confined to the lower temperatures, and in order to bring them out more clearly only the lower temperature range (up to 300° K) is shown in the illustrations that follow. the remaining sections of the curves of Figure 7 are extensions of the lines shown in the diagram, except in the case of tungsten, which undergoes a transition to the four-unit status at about 325° K.
Figure 7: Specific Heat
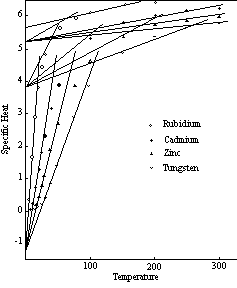
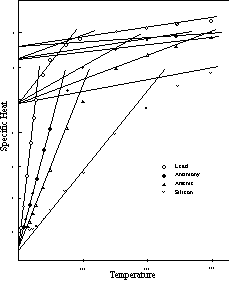
Figure 8 is a similar group of specific heat curves for four of the electronegative elements with the -0.66 initial level. Aside from this higher initial level these curves are identical with those of Figure 7 when all are reduced to a common temperature scale. The transition to the two-unit vibration takes place at 4.63 (21/3 R) regardless of the higher initial level. This point will be given further consideration in Chapter 7. The upper portions of the lead and antimony curves, which are not shown on the graph, are extensions of the lines in the diagram. Arsenic and silicon have transitions at temperatures above 300° K.
Figure 8: Specific Heat
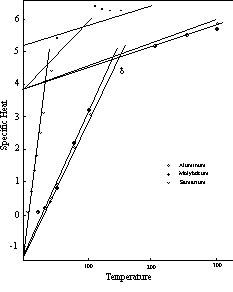
As noted in Chapter 5, there are a number of elements that undergo a modification of the temperature scale at the first transition point. Two curves with the modified second segment are shown in Figure 9.
These two curves actually apply to four elements, as the specific heat of lithium follows the aluminum curve, while that of ruthenium coincides with the molybdenum curve. Coincidence of the specific heat curves of different elements, as in the instances mentioned, is not as uncommon as might be expected. The number of possible curve patterns is quite limited, and, as we will see in the next chapter, where the nature of the change in the temperature will be examined, the temperature factors are confined to specific values mainly within a relatively narrow range.
Also included in Figure 9 is an example of a specific heat curve for an element which undergoes an internal rearrangement that modifies the thermal pattern. The measurements shown for samarium follow the regular pattern up to the vicinity of the first transition point at 35° K. Some kind of a modification of the molecular structure is evidently initiated at this point in lieu of, or in addition to, the normal transition to the two-unit vibrational status. This absorbs a considerable quantity of heat, which manifests itself as an addition to the measured specific heat over the next portion of the temperature range. By about 175° K the readjustment is complete, and the specific heat returns to the normal curve. Most of the other rare earth elements undergo similar readjustments at comparable temperatures. Elsewhere, if changes of this kind take place at all, they almost always occur at relatively high temperatures. The reason for this peculiarity of the rare earth group is, as yet, unknown.
Figure 9: Specific Heat
All of the types of deviations from the regular pattern that have been discussed thus far are found in the electronegative elements of the lower rotational groups. There is also an additional source of variability in the specific heats of these elements, as their atoms can combine with each other to form molecules. The result is a wide enough variety of behavior to give almost every one of these elements a unique specific heat curve. Of special interest are those cases in which the variation is accomplished by omitting features of the regular pattern. The neon curve, for example, is a single straight line from the -1.32 initial level to the melting point. the specific heat curve of a hydrogen molecule, Figure 10, is likewise a single straight line, but hydrogen has no rotational specific heat component at all, and this line therefore extends only from the negative initial level, -1.32, to the specific heat of the positive initial level, +1.32, at which point melting takes place.
The specific heats of binary compounds based on the normal orientation, simple combinations of Division I and Division IV elements, follow the same pattern as those of the electropositive elements. In these compounds each atom behaves as an individual thermal unit just as it would in a homogeneous aggregate of like atoms. the molecular specific heats of such compounds are twice as large as the values previously determined for the elements, not because the specific heat per atom is any different, but because there are two atoms in each formula molecule.
Figure 10: Specific Heat-Hydrogen
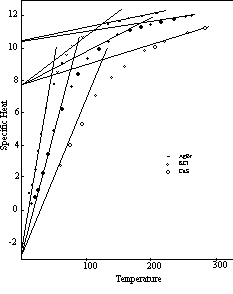
The curves for KCl and CaS, Figure 11, illustrate the specific heat pattern of this class of compounds. Some binary compounds of other structural types conform to the same regular pattern as in the curve for AgBr, also shown in Figure 11.
Figure 11
As in the elements there is also a variation of this regular pattern in which certain compounds of the electronegative elements have a higher initial level, but in the compounds such as ZnO and SnO this level is zero, rather than -0.66, as it is in the elements.
Some of the larger molecules similarly act thermally as associations of independent atoms. CaF2 and FeS2 are typical. More often, however, two or more of the constituent atoms of the molecule act as a single thermal unit. For example, both the KHF2 molecule, which contains four atoms, and the CsClO4 molecule, which contains six, act thermally as three units. In the subsequent discussion the term thermal group will be used to designate any combination of atoms that acts as a single thermal unit. Where individual atoms participate in thermal motion jointly with groups of atoms, the individual atoms will be regarded as monatomic groups. On this basis we may say that there are three thermal groups in each of the KHF2 and CsClO4 molecules.
The great majority of compounds not only form thermal groups but also alter the number of groups in the molecule as the temperature varies. A common pattern is illustrated by the chromium chlorides. CrCl2 acts as a single thermal group at very low temperatures; CrCl3 as two. The initial specific heat levels are -1.32 and -2.64 respectively. There is a gradual increase in the average number of thermal groups per molecule up to the first transition point, at which temperature all atoms are acting independently. At the initial point of the second segment of the curve this independent status is maintained, and above the transition temperature the CrCl2 molecule acts as three thermal groups, while CrCl3 has four.
At the present stage of the investigation we can determine from theory the possible ways in which a molecule can split up into thermal groups, but we are not yet able to specify on theoretical grounds just which of these possibilities will prevail at any given temperature, or where the transition from one to the other will take place. The theoretical information thus far developed does, however, enable us to analyze the empirical data and to establish the specific heat pattern of each substance; that is, to determine just how it acts thermally. Aside from some cases, mainly involving very large molecules, where the specific heat pattern is unusually complex, and in those instances where experimental errors lead to erroneous interpretation, it is possible to identify the effective number of thermal groups at the critical points of the curves. Once this information is available for any substance, the definition of its specific heat curve is essentially complete, except for the temperature scale, the determinants of which will be identified in Chapter 7. Where n is the number of active thermal groups in a compound, the initial level is -1.32 n, the initial point of the second segment of a Type 1 curve is 3.89 n, and the first transition point is 4.63 n.
The tendency of the atoms of multi-atom molecules to form thermal groups is particularly evident where the molecules contain radicals, because of the major differences in the cohesive forces that are responsible for the existence of the radicals. The extent to which the association into thermal groups is maintained naturally depends on the relative strength of the cohesive and disruptive forces. Those radicals such as OH and CN in which the bonds are very strong act as single thermal groups under all ordinary conditions. Those with somewhat weaker bonding—CO3, SO4, NO3, etc.,—also act as single units at the lower temperatures. Thus we find that at the initial points of both the first and second segments of the specific heat curves there are two groups in MnCO3, three in Na2CO3, four in KAl(SO4)2, five in Ca3(PO4)2, and so on. At higher temperatures, however, radicals of this class split up into two or more thermal groups. Still weaker radicals such as ClO4 constitute two thermal groups even at low temperatures.
It was mentioned in Volume I that the boundary line between radicals and groups of independent atoms is rather indefinite. In general, the margin of bond strength required for a structural radical is relatively large, and we find many groups commonly recognized as radicals crystallizing in structures such as the CaTiO3 cube in which the radical, as such, plays no part. The margin required in thermal motion is much smaller, particularly at the lower temperatures, and there are many atomic groups that act thermally in the same manner as the recognized radicals. In Li3CO3, for example, the two lithium atoms act as a single thermal group, and the specific heat curve of this compound is similar to that of MgCO3 rather than of Na2CO3.
Extension of the thermal motion by breaking some of the stronger bonds at the higher temperatures gives rise to a variety of modifications of the specific heat curves. For example, MoS2 has only two thermal groups in the lower range, but the S2 combination breaks up as the temperature rises, and all atoms begin vibrating independently. VCl2 similarly goes from one group to three. Splitting of the radical accounts for a change from two groups to three in SrCO3, from one to three in AgNO3, and from two to six in (NH4)2SO4. All of these alterations take place at or prior to the first transitional point. Other compounds make the first transition on the initial basis and break up into more thermal groups later. In a common pattern, a radical that acts as one thermal group at the low temperatures splits into two groups in the temperature range of the second segment of the curve, just as the CO3 radical in SrCO3, PbCO3 and similar compounds does at a lower level. There are a number of structures such as KMnO4 and KIO3, where this increases the number of groups in the molecule from two to three. Pb3(PO4)2, in which there are two radicals, goes from five to seven, and so on.
The effect of water of crystallization is variable, depending on the strength of the cohesion. For example, BaCl2.2H2O acts as three thermal groups at the lower temperatures, the water molecules being firmly bound to the atoms of the compound. As the temperature increases these bonds give way, and the molecule begins vibrating on a five-group basis. In Al2(SO4)3.6H2O and in NH4Al(SO4)2.12H2O the bonds with the water molecules remain fixed through the entire experimental range, up to about 300° K, and the thermal groups in these hydrates are five and six respectively, just as in the corresponding anhydrous compounds.
An example of a drastic change in thermal behavior due to the disruption of inter-atomic bonds by thermal forces is shown in Figure 12. The radical CrO3 in the compound AgCrO3 is a single thermal group at very low temperatures. There is a gradual separation into two groups in the temperature range up to the first transition point, and the change to the two-unit vibration is made on the basis of a two-group radical. At about 150° K all four atoms in the radical begin vibrating independently, and the molecule undergoes a transition from the second segment of a three-group curve to the second segment of a five-group curve. At about 250° K the compound makes the normal transition to three-unit vibration, continuing as five thermal groups.
The compounds used as examples in the foregoing discussion were selected mainly on the basis of the availability of experimental data within the significant temperature ranges. For an accurate definition of the slope of each of the straight line segments of any empirical curve it is necessary to have measurements in the temperature range where the deviations due to the proximity of a transition point are negligible. The examples have been taken from among those of the experimental results that satisfy this requirement.
Figure 12: Specific Heat—AgCrO3
In a theoretical treatment of specific heat such as that in this present work it is necessary to deal with this quantity on a per molecule basis. For practical application, however, it is more convenient to use the specific heat per unit of mass, and most of the collected data are expressed in this manner. It should be noted that the effect of association into thermal groups is to reduce the specific heat per unit of mass. For this reason, the specific heat of most complex compounds is relatively low at low temperatures, and rises toward the values applicable to individual atoms as increasing temperature breaks up the original thermal groups.
The simplest organic compounds, those composed of only two or three structural units, generally divide into no more than two thermal groups. Many of the somewhat larger organic molecules, particularly among the ring structures and branched compounds, follow the same rule. The specific heat relations of these compounds are similar to those of the inorganic compounds, except that there are more organic compounds in which the thermal motion is restricted to one rotational unit. These substances, the hydrocarbons and some other compounds of the lower elements, undergo a transition to a positive initial level on reaching their first (and only) transition point. The resulting specific heat curve, the one illustrated in Figure 3, is not much more than a straight line with a bend in it. A few compounds, including ethane and carbon monoxide, even omit the bend, and do not make the transition to the positive initial level.
Further addition of structural units, such as CH2 groups, to the simple organic compounds results in the activation of internal thermal groups, units that vibrate thermally within the molecules. The general nature of the thermal motion of these internal groups is identical with that of the thermal motion of the molecule as a whole. But the internal motion is independent of the molecular thermal motion, and its scalar direction (inward or outward) is independent of the scalar direction of the molecular motion. Outward internal motion is thus coincident with outward molecular motion during only one quarter of the vibrational cycle. Since the effective magnitude of the thermal motion, which determines the specific heat, is the scalar sum of the internal and molecular components, each unit of internal motion adds one-half unit of specific heat during half of the molecular cycle. It has no thermal effect during the other half of the cycle when the molecule as a whole is moving inward.
Because of the great diversity of the organic compounds the specific heat patterns occur in a variety that is correspondingly large. The effect of internal motion in those of the organic compounds in which it is present is well illustrated, however, by the specific heats of the normal paraffins. The values of the initial levels and the specific heat at T1 for the compounds of this series in the range from C3(propane) to C16(hexadecane) are listed in Table 21, together with the number of internal thermal units in the molecule of each compound.
Table 21: Specific Heats -Paraffin Hydrocarbons
| Internal Thermal Units |
Initial Levels |
Specific Heat at T1 |
||
|---|---|---|---|---|
| 1st | 2nd | |||
| Propane | 0 | -2.64 | 2.64 | 9.27 |
| Butane | 0 | -2.64 | 2.64 | 9.27 |
| Pentane | 2 | -2.64 | 6.62 | 13.90 |
| Hexane | 3 | -2.64 | 7.95 | 16.22 |
| Heptane | 4 | -3.96 | 9.27 | 18.54 |
| Octane | 5 | -3.96 | 10.59 | 20.86 |
| Nonane | 6 | -5.30 | 11.92 | 23.18 |
| Decane | 7 | -5.30 | 13.24 | 25.49 |
| Hendecane | 8 | -5.30 | 14.57 | 27.81 |
| Dodecane | 9 | -6.62 | 15.89 | 30.12 |
| Tridecane | 10 | -6.62 | 17.22 | 32.44 |
| Tetradecane | 11 | -6.62 | 18.54 | 34.76 |
| Pentadecane | 12 | -6.62 | 19.86 | 37.08 |
| Hexadecane | 13 | -7.95 | 21.19 | 39.39 |
Propane and butane have only the two molecular thermal groups corresponding to the positive and negative ends of the molecules, and their specific heat at T1 is the normal two-group value: 9.27. Beginning with two internal groups in pentane, each added CH2 structural group becomes and internal thermal unit, and adds 2.317 to the total specific heat of the molecule at the transition point. The initial level of the first segment of the specific heat curve is -2.64 (the two-group value) in the lower compounds, and changes slowly, adding units of -1.32, as the length of the chain increases. The initial level of the second segment is 2.64 in butane and propane. In the higher compounds, each of which consists of n structural groups (CH2 and CH3), this second initial level is 1.324 n.
The values thus derived theoretically are all consistent with the experimental curves. In a few cases the intersection of the two curve segments may not coincide with the calculated specific heat of the transition point, but these deviations, if they are real, are small enough to be explainable on the basis of changes in the temperature factors, the nature of which will be one of the subjects of discussion in Chapter 7.
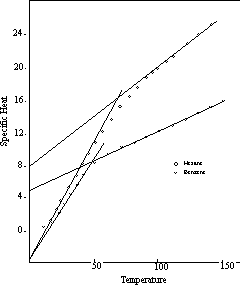
Branching of a hydrocarbon chain tightens the structure and tends to reduce the number of internal thermal units. For example, octane has five internal thermal units, and a specific heat of 20.86 at the transition point. But 2,2,4-trimethyl pentane, a branched compound with the same composition, has no internal motion at all, and the T1 specific heat of this compound is 9.27, identical with that of the C3 paraffin, propane. Ring formation has a similar effect. Ethyl-benzene and the xylenes, which are also C8 compounds, have some internal motion, but their T1 specific heats are 11.59 (one internal unit) and 13.90 (two internal units) respectively, well below the octane level. In Figure 13 the specific heat curves of hexane (straight chain) and benzene (ring), both C6 hydrocarbons, are contrasted.
The subject matter of this and the preceding five chapters consists of various aspects of the volumetric and thermal relations of material substances. The study of these relations was the principal avenue of approach to the clarification of basic physical processes that ultimately led to the identification of the physical universe as a universe of motion, and the determination of the nature of the fundamental features of that universe. There relations were examined in great detail over a period of many years, during which thousands of experimental results were analyzed and studied. Incorporation of the accumulated mass of information into the theoretical structure was the first task undertaken after the formulation of the postulates of the Reciprocal System of theory, and it has therefore been possible to present a reasonably complete description of each of the phenomena thus far discussed, including what we may call the small-scale effects.
Beginning with the next chapter, we will be dealing with subjects not covered in the inductive phase of the theoretical development. In this second phase, the deductive development, we are extending the application of the theory to all of the other major fields of physical science, in order to demonstrate that it is, in fact, a general physical theory. Obviously, where the area to be covered is so large, no individual investigator can expect to carry the development into great detail. Consequently, some of the conclusions expressed in the subsequent pages with respect to the small-scale features of the areas covered are subject to a degree of uncertainty. In other cases it will be necessary to leave the entire small-scale patter for some future investigation.
Figure 13: Specific Heat
