CHAPTER X
Some Further Details
The two preceding chapters have drawn a general picture of the origin and evolution of the quasars, as seen in the light of the Reciprocal System of theory, and have presented sufficient evidence from observation to show that this theoretical picture is a true and accurate representation of the physical phenomena. This accomplishes the specific objectives of the work, which were, first, to produce the general explanation of the quasars that conventional theory has been unable to discover, and second, by so doing to demonstrate the ability of the Reciprocal System to account for the phenomena of the far-out regions of the universe in the same comprehensive and accurate way in which it explains the basic physical relations that have been the primary subject matter of previous publications. Further development of the details of the behavior of the quasars and associated objects is a task for the astronomers, who have the facilities for gathering the additional observational information that will be required. There are, however, a few conclusions with respect to some of these details that can be drawn from the data already available, and since these points will serve, to some degree, as further confirmation of the findings of the previous chapters, they will be discussed briefly before concluding the presentation.
In essence, this chapter will be a sort of catch-all for the things that should be said, but did not fit into the previous discussion. Because of the heterogeneous character of this material no attempt will be made at a systematic order of presentation, except that we will deal first with those items that are most directly connected with the subject matter of Chapters VIII and IX, and will then turn our attention to the various lines of inquiry that are opened up by the results of this initial phase of the supplementary investigations. It should be noted that some of the conclusions reached in this portion of the work are less firmly based than those of the two preceding chapters, and may require a certain amount of modification in the future as the accumulation of observational data continues.
One significant, and hitherto unexplained, item that is clarified by the theoretical development is the existence, in some quasars, of absorption spectra that are red shifted by different amounts. The stellar explosions that initiate the chain of events leading to the ejection of a quasar from the galaxy of origin reduce these stars mainly to kinetic and radiant energy. The remainder is broken down into dust and gas particles. A portion of this material penetrates into the sections of the galaxy surrounding the sector where the explosions are taking place, and when one such section is ejected as a quasar it contains some of this fast-moving dust and gas. Inasmuch as the maximum particle speeds are above the requirement for escape from the gravitational attraction of the individual stars, a part of this material ultimately assumes the form of a cloud of dust and gas around the quasar—an atmosphere, we might call it—and the radiation passes through this cloud, giving rise to absorption lines. This material is moving at nearly the same speed as the quasar itself, and the absorption redshift is therefore approximately equal to the emission redshift.
From a consideration of the various factors involved, we may deduce that in many instances the fragment of the original galaxy that is ejected as a quasar contains stars of such an advanced age that they reach the destructive limit and explode while the quasar is moving outward. This not only increases the amount of dust and gas, but may also release sufficient energy to increase the speeds of some of the particles by one or more additional units of motion in time. If one unit is added to the original single unit, the two time units that are now effective are equivalent to 8-2, or 6, space units, and the explosion speed of the particles involved therefore becomes 3 z½ rather than 3.5 z½. The quasar radiation passing through particles moving at this speed acquires an absorption spectrum with a redshift z + 3z½. Further additions to the explosion speeds of the gas and dust particles have a similar effect, the general equation applicable to n units in time being y2 (8-n) z½ equivalent space units. It should be noted, however, that in the general situation two of the single units of motion in time are required to increase the two-dimensional speed of objects moving faster than light by one unit. This does not apply to the first unit, since the unit speed in space due to the normal recession is also a unit speed in time (that is, one unit of space per unit of time), hence one single unit of motion in time results in a change from unit one-dimensional speed to unit two-dimensional speed. Beyond this point two time units must be added to increase n by one unit. Where the available energy only amounts to the equivalent of one additional time unit we therefore find intermediate values of the absorption; i.e., 3.25 z½, and so on. The additional explosions occurring within the quasar have no effect on the speed of the quasar as a whole, and that speed remains constant regardless of the changes that are taking place in the mo
| Absorption Redshift | |||
|---|---|---|---|
| f | zex | calc. | obs. |
| PKS 0237-23 | |||
| 3.5 | 1.918 | 2.218 em | |
| 2.218 | 2.202 | ||
| 3.0 | 1.644 | 1.944 | 1.955 possible |
| 2.5 | 1.370 | 1.670 | 1.671 |
| 1.670 | 1.656 | ||
| 1.595 possible | |||
| 2.25 | 1.233 | 1.533 | 1.513 |
| 2.0 | 1.096 | 1.396 | 1.364 |
| PKS 1116+12 | |||
| 3.5 | 1.841 | 2.118 em | |
| 3.25 | 1.705 | 1.982 | 1.947 |
| TON 1530 | |||
| 3.5 | 1.786 | 2.046 em | |
| 2.046 | 2.053 | ||
| 3.25 | 1.658 | 1.918 | 1.922 |
| PHL 5200 | |||
| 3.5 | 1.734 | 1.980 em | |
| 1.980 | 1.950 | ||
| 3.25 | 1.610 | 1.856 | 1.891 |
tions of the constituent particles. This quasar speed never exceeds one time unit (redshift factor 3.5) because the portions of the galaxy of origin overlying the nucleus where the explosions are taking place are not able to offer sufficient resistance to permit the pressure in the interior to build up to the point where it would eject the quasar at a two-unit speed. Indeed, as we will see later, the ejection may take place even before the pressure is high enough to produce a one-unit speed in time, in which case no quasar is formed. Of course, if the galaxies of origin were larger a higher pressure would be possible, but, as pointed out earlier, the limiting age of matter establishes a galactic age limit, which automatically limits galactic size, and the existence of larger galaxies is therefore precluded.
Unfortunately, the amount of observational information available for the purpose of checking these theoretical conclusions is very limited. In fact, only one of the quasars thus far investigated has a system of absorption redshifts that is extensive enough to enable a good comparison with the theory. As can be seen from Table IV, however, the results of this one full-scale test of the theory are very satisfactory. Column 1 of the table gives the number of equivalent units of spatial motion added to the total quasar motion (and redshift) by the explosion speed (the redshift factor, as it was called in the preceding paragraph). Column 2 is the corresponding excess redshift. In column 3 the recession redshift, which was subtracted from the emission redshift to arrive at the excess redshift under the conditions applying to the quasar as a whole (redshift factor 3.5) is added back again to give us the total redshift at the particle speed which is attained by reason of the energy released in the additional stellar explosions. This is the theoretical absorption redshift at the specified redshift factor. The values in column 4 are the observed redshifts, 4? the emission values being distinguished by the notation “em.”
As the table shows, seven absorption redshifts have been reported for the quasar PKS 0237-23, of which two are listed as only “possible.” There are five theoretical absorption redshifts in the range of redshift factors from 3.5 to 2.0, and all of these are represented in the list of seven observed values, within the margin that can be ascribed to additional motion of a random character. In one instance, two of the observed redshifts are close enough to be identified with the same theoretical value. The only reported value that cannot be theoretically accounted for is one of the “possible” redshifts (1.595).
The three other quasars included in the table have absorption redshifts that agree with the values calculated on the basis of the first increment of particle motion; that is, with a redshift factor of 3.25. All but one of the remaining absorption redshifts reported to date (1970) are close to the emission values and thus readily understandable theoretically. The single exception is a 0.6128 measurement for the quasar PHL 938. If the interpretation of the spectrum that arrives at this result proves to be valid, the absorption in this instance must be due to some phenomenon other than that responsible for all of the other absorption redshifts that have thus far been measured. Although the amount of observational information available for correlation with the theoretical deductions is small, the agreement is so close that it constitutes a rather strong case in favor of the validity of the theoretical development. But we do not have to rely entirely on this mathematical correlation, as the theoretical conclusion that the absorption phenomenon is due to additional stars reaching the destructive limit and exploding during the outward progress of the quasar can be verified by other means, inasmuch as such explosions have further consequences which we can subject to examination.
An interesting point in this connection is that the 1.891 absorption redshift given for PHL 5200 in Table IV is a relatively recent value that was not found in earlier observations of this quasar, and E. M. Burbidge suggests that a change may have occurred in the emission from this object.41 While the evidence is not sufficient to establish conclusively that such an event did take place, this is just the kind of a thing that the theory predicts: the appearance of a new lower absorption redshift either because of additional stellar explosions in the quasar or because some high-speed material already present has moved out to where it can cause absorption.
Explosions of this kind could occur relatively soon after the original ejection, as some stars of a very advanced age might be present in the ejected fragment of the original galaxy. Obviously, however, the probability of reaching a limiting age increases with time, and the older quasars are therefore the most likely to have complex absorption spectra. Because of the outward progression, the nearby regions, with the possible exception of those that are very near, contain only relatively young individuals, whereas the more distant regions contain not only the young quasars that have originated there, but also some older ones that have moved outward since their origin. The average age of the visible quasars thus increases with distance. Furthermore, there is an additional selection effect because the secondary explosions in the older quasars increase the intensity of the radiation and thus enable locating them at distances where the younger and fainter units cannot be detected. On the basis of these considerations we may deduce that extensive absorption systems should be found preferentially at the maximum distances.
Some observers have concluded that there is a general correlation between distance and the presence of absorption spectra. The Burbidges, for instance, point out that 7 of the 14 quasars with z greater than 1.9 in their Table 3.1 have absorption lines, and they conclude that “at present the admittedly poor statistics suggest that the presence of absorption lines is strongly correlated with large redshift.”42 Other investigators have contested this assertion. It should therefore be noted that our theoretical development indicates that absorption lines with redshifts approximately equal to the emission redshift are possible for all quasars, but that the multiple redshift systems should be confined mainly to the more distant regions. In this connection it is significant that all of the quasars listed in the upper section of the Burbidge Table 3.7, the quasars with mare than one absorption line, have redshifts in the neighborhood of 2.00.
The various changes that take place during the aging of the quasars necessarily affect their spectral characteristics, and it should therefore be possible to gain some further insight into this aging process by analyzing the quasar spectra. A detailed analysis of this kind is a complex task that is beyond the scope of this work, but we can get a good indication of the general situation without having the complete picture. We can expect, for instance, that the evolution of the quasars from the early to the later stages will be accompanied by color changes. If we can identify certain specific color characteristics that vary systematically with the quasar age, this will be sufficient for present purposes, even though we are not able, as matters now stand, to produce a full explanation of the origin of these changes.
A study of the various possibilities has indicated that the color measurement most suitable for this application is the difference between the quasar magnitude as measured through an ultraviolet filter and that measured through a blue filter, the U-B index, as the astronomers call it. In normal stars, those that fall on the so-called “main sequence,” color is related to the optical magnitude, and the U-B index is positive; that is, more energy is received in the blue range. The index is also positive in ordinary galaxies, which are composed mainly of such stars. By reason of the inversion that takes place when the speed of light is exceeded, the theoretical development indicates that in the quasars the color should be related to the magnitude of the radio emission rather than to the optical magnitude, and the U-B index should be negative, indicating that more energy is received in the ultraviolet range. All of the U-B values quoted herein will be negative, and should be so understood. Figure 8 demonstrates that the U-B value is, in fact, independent of the optical magnitude; as the theory predicts. For purposes of this diagram the absolute magnitude has been calculated on the basis of the l/d relation previously established, taking an excess redshift value of 1.00 as a standard. The radio flux measurements that will be used later will be converted to the absolute basis in the same manner. There is a large scatter in the diagram, which includes the values for all of the quasars in the Burbidge Table 3.1 within the indicated magnitudes, and the amount of scatter increases somewhat with the magnitude, but it is evident that in this magnitude range,
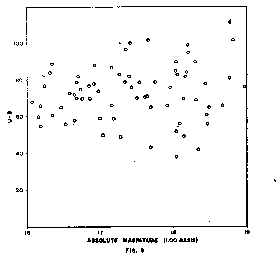
the range with which we will be mainly concerned, the average U-B value is constant, and hence there is no systematic relation between U-B and optical magnitude.
In examining the other side of the theoretical proposition, the conclusion that the U-B value should be related to the radio flux, we find the situation complicated by the existence of two distinct classes of quasars, a fact that has not hitherto been recognized. For purposes of classification we will establish dividing lines at U-B = 0.60 and at an absolute radio flux (R.F.) of 6.0 measured at 178 MHz. All quasars with U-B values of less than 0.60 will be placed in Class I. Those which have higher U-B but low R.F. (below 6.0) are continuous with the low U-B quasars in their properties and will also be placed in Class I. The high R.F: high U-B quasars form a discontinuous group with quite different properties, and they will constitute Class II.
Figure 9 shows the relation between U-B and R.F. for those of the Class I quasars listed in the Burbidge Table 5.1 for which the necessary information is available. The scales of the diagram are inverted in order to conform to the conventional practice of showing increas-
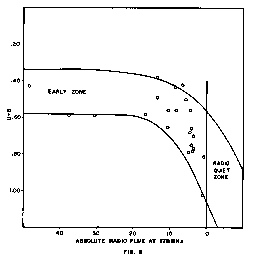
ing age from left to right and decreasing activity from top to bottom. When the quasar is first ejected from the galaxy of origin its constituents are in a state of extreme activity and its radio flux is abnormally high. Only one of the quasars included in the present study is still in this very early stage. This is 3C 196, which has U-B = 0.43 and absolute R.F. = 48.3. Its quasar distance is 0.817, which makes it the most distant Class I quasar in the Burbidge table.
After the initial spurt of activity dies down to some extent, the quasar can be found in the zone designated “early” in the upper left of the diagram. As it ages and its activity drops still farther it moves to the right (toward lower R.F.) and downward (toward higher U-B). Ultimately it passes the zero flux line and enters the radio quiet zone.
The quasars that are included in the group under consideration were originally located by radio observation and later identified optically. As Fred Hoyle puts it, “To the optical astronomer, radio data serves like a good dog on a hunt.” The capabilities of the radio facilities available at the time the observational work was done therefore
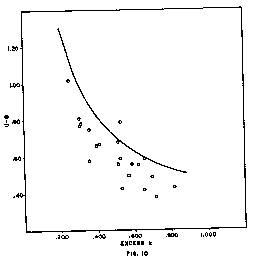
establish the limit to which the observations could be carried; that is, these facilities were capable of detecting a Class I quasar of the earliest type shown on the diagram at a certain maximum quasar distance, in the neighborhood of 0.900. It then follows that at distances less than this maximum the same facilities were capable of detecting less powerful radio sources, and the range of observed U-B values should therefore widen as the distance decreases. Figure 10 shows that this is true. The curved line in this diagram is a theoretical cut-off limit based on a linear relation between U-B and radio emission. This relation assumed for the purposes of the diagram is probably not accurate, but it is close enough to show that the observed Class I quasars are, in fact, subject to an observational limit of the nature required by the theory.
This limit is dependent entirely on the kind of equipment and techniques available, as the distribution of these Class I quasars in space is theoretically uniform from a large scale standpoint. As more powerful and versatile equipment becomes available, the cut-off limit will therefore move outward to greater distances. Considerable progress in this respect has already been made even in the short time since the Burbidge list which we are using for our analysis was published in 1967. At the moment, however, the fact in which we are interested is that, with the observational facilities available prior to the compilation of the 1967 list, Class I quasars—fast moving galactic fragments that are in essentially the same condition, aside from a decrease in activity, in which they were originally ejected from their galaxies of origin—could not be detected at distances greater than about 0.900, and those of this class that are old enough to have U-B indexes above 0.60 could not be detected beyond a distance of approximately 0.700.
The foregoing discussion is rather elementary, and it may seem to be belaboring the obvious point that stronger sources can be detected at greater distances. Its significance lies in the fact that there are other quasars with U-B indexes above 0.60 that can be detected beyond a quasar distance of 0.700. Indeed, we can follow them all the way out to the ultimate limit at 2.00. It is clear, then, that we have here a class of quasars that are not in the same condition in which they were originally ejected. In order to move into the observational range, these more distant quasars must undergo some process that releases a substantial amount of additional radiant energy at radio wavelengths.
We have already deduced that such a process exists. From a consideration of the absorption redshifts, we have concluded that secondary explosions occur in the older quasars due to the fact that some of the constituent stars reach the age that corresponds to the destructive limit. Obviously, this is just the kind of a process that is required in order to explain the emergence of a second class of quasars at distances beyond the observational limit of the Class I objects. A very important point here is that a secondary explosion of this kind is a natural sequel to the explosion in the galaxy of origin. That original explosion was initiated when the oldest stars in the galaxy reached the age limit. The stars in the ejected fragment that became the quasar were younger, but many of them were also well advanced in age, and after another long period of time some of them must also arrive at the destructive limit.
The original stellar explosions occurred outside the portion of the galaxy that was ejected as a quasar, and the radio emission from the Class I quasar is mainly a result of the extremely violent push that caused the ejection. On the other hand, the secondary explosions occur in the body of the quasar itself, and the emission from the Class II
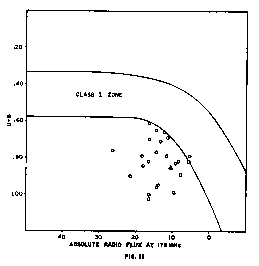
quasars therefore comes directly from the exploding stars. This difference in origin is reflected in the relation between the U-B index and the radio flux, and hence we are able to utilize this relation to draw a definite distinction between the two classes. Figure 11 is a plot of U-B vs. R.F. for the Class II quasars in the Burbidge table. As can be seen, the points representing these objects fall entirely outside the section of the diagram occupied by the quasars of Class I. There is no indication in this diagram that the Class II quasars follow any kind of an evolutionary pattern, but we will give this question some consideration later in another connection.
The quasar 3C 273 is of particular interest. This is definitely a Class II quasar, according to the criteria that have been defined, but its distance is far out of line with that of all other known objects in its class. No other Class II quasar in the group now under examination has a recession redshift of less than 0.052, equivalent to a quasar distance of about 0.800, whereas the quasar distance of 3C 273 is only 0.156. Ordinarily we can consider that when we measure the redshift of an object we are also determining its maximum possible age, as this age cannot be greater than the time required to move out to its present position. On this basis we would interpret the low redshift of 3C 273 as an indication that it is an unusually young Class II quasar. This could be true. It was pointed out in the earlier discussion that the secondary explosions may occur relatively soon after the original ejection, inasmuch as some of the stars in the galactic fragment ejected as a quasar may already be near the age limit at the time of ejection. Very young Class II quasars are therefore definitely possible, but the absence of Class II quasars between 3C 273 and distance 0.800 suggests that they must be very rare.
But 3C 273 is not necessarily young. It may be very much older than the 0.156 distance would indicate, as the general relation between redshift and age does not hold good at the very short distances where the magnitude of the possible random motion is comparable to that of the recession. Two galaxies that are separated by a distance in the neighborhood of their mutual gravitational limit can maintain this separation indefinitely, and the width of the zone in which the relative motion can be little or none at all is increased considerably if there is random motion with an inward component. Hence 3C 273 may have spent a long time somewhere near its present position and may be just as old as the quasars at distances around 0.800.
The observational evidence available at the moment is not adequate to enable making a definite decision between these alternatives, but where we have a choice between attributing a seeming abnormality to a chance coincidence that has resulted in an object of an unusual type being located very close to us, or attributing it to another kind of abnormality which we know that the object in question does possess—its proximity—the latter is clearly entitled to the preference pending the accumulation of further evidence. We therefore conclude tentatively that 3C 273 is about as old as the Class II quasars in the vicinity of distance 0.800. The position of 3C 273 in Figure 11 is indicated by a triangle. As can be seen from the diagram, this quasar is among the weaker radio emitters in its class (although we receive a large radio flux from it because it is so close), but so far as its properties are concerned it is not abnormal, or even a borderline case. Its proximity therefore provides a unique opportunity to observe a member of a class of objects that can otherwise be found only at great distances.
While each quasar as a whole is moving at a speed in excess of the speed of light, and the same is true of most of the constituent stars, the particles of matter of which these stars are composed are mainly moving at less-than-unit speeds in the early stages of the existence of the quasar. The radiation from these stars therefore has the normal characteristics of stellar radiation even though the ultra high speed of the quasar results in a distribution of this radiation only in two dimensions. At the time of ejection, however, the quasar also contains some matter that is moving at speeds in excess of unity, and the radiation from this matter is emitted in two dimensions only; that is, it is polarized. Some of this polarized radiation is depolarized in passing through the force fields of the surrounding stars, but a portion of it gets through unchanged, and we therefore find that an appreciable portion of the radiation received from a young Class I quasar, or from any Class II quasar, is polarized.
The percentage of polarization of the radiation as received is not an accurate measure of the magnitude of the original two-dimensional emission because of the great variability in the amount of depolarization, which depends on a number of factors, including the density and other properties of the matter present along the line of travel of the radiation. Some indication of the extent of this variability in the depolarization can be gained by examination of the polarization of the pulsed radiation received from the pulsars. For reasons which will be explained in Chapter XII, the radiation from these objects should be completely polarized as emitted, and lower polarization measurements therefore constitute evidence of depolarization.
Studies of the pulsar PSR 0833, the second youngest object of this kind thus far discovered, show the radiation as received to be 100 percent polarized,43 indicating that there is no modification on the way out of the region of origin. R. N. Manchester reports that in PSR 2022-I-51 the “polarization of the leading component is essentially complete,”44 and he finds the polarization of two other pulsars to be as high as 90 percent. In most instances, however, a substantial amount of depolarization is indicated. The maximum polarization measured in the pulsed radiation from the pulsar NP 0532 in the Crab Nebula, for example, is a little over 25 percent,45 and some of the measurements on other pulsars have produced still lower values.
It can be anticipated that there will be a similar variability in the depolarization occurring in the quasars, but because of the large number of individual radiation sources in each quasar, the average depolarization of quasar radio emission should be relatively constant. We may therefore conclude that the polarization P of the radiation received from the quasars is equal to the polarization of the emitted radiation Po multiplied by a constant factor kl, the depolarization factor; that is, P = klPo.
Radiation from thermal sources has a small component extending into the radio region, but this thermal radiation accounts for only a negligible portion of the radio emission from the quasars and associated objects. Almost all of the radiation that is received from these objects at radio wavelengths is radiation of the inverse, or cosmic, type that originates at speeds greater than that of light. Processes that would result in radiation of wavelength l/n (in natural units) if they took place at speeds less than unity produce radiation of wavelength n when they occur at speeds greater than unity. The natural unit of distance, 0.456×105 cm, is in the wavelength range of visible light. The cosmic equivalent of thermal radiation is therefore in the ultraviolet and x-ray range (which explains the negative U-B index of the quasars) and the cosmic gamma rays are received at radio wavelengths.
Thus it is wholly unnecessary to postulate the existence of complicated processes involving highly improbable physical conditions in order to explain this radiation. The radio emission is a perfectly normal result of a normal physical phenomenon, as any such common and ubiquitous product must be. It is a natural consequence of violent explosions that disrupt atomic structures, differing from the similar emission of x-rays and gamma rays in violent events only in that it is a product of the inverse process.
Inasmuch as motion at speeds in excess of that of light takes place in only two dimensions, radiation, which is a motion, is confined to these two dimensions, and all radiation emitted from atoms moving at these speeds is completely polarized. The total radiation from a quasar, or any other galaxy, that does not contain any appreciable number of very old stars, is practically constant over the relatively short active lifetime of a Class I quasar. The amount of polarized radiation from an average quasar of this class at any time during its active period is therefore proportional to the polarization; that is, Ep = k2P0. We have previously found that P0 = P/k1. Substituting the latter value for P0 in the energy equation, we then obtain EP = (k2/k1) P = kP. The average quasar has a specific distribution of radiation frequencies, and for such a quasar this energy equation is applicable to any given range of frequencies, as well as to the total radiation. We thus arrive at the conclusion that the energy received from a Class I quasar at radio wavelengths, the radio flux, is proportional to the polarization.
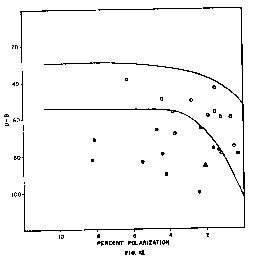
A direct comparison between these two quantities produces results that are consistent with this theoretical conclusion, but because of the large scatter in the diagram due to uncertainties in the polarization measurements and the lack of integrated values of the polarization, interpretation of the results obtained in this manner is somewhat ambiguous. The best way of establishing the validity of the theoretical finding appears to be a demonstration that the decrease in polarization of the Class I quasars with increasing age (as indicated by the U-B index) follows the same path as the decrease in radio flux (Figure 9).
Figure 12 duplicates Figures 9 and 11, substituting polarization for radio flux. It covers all of the quasars from the 3C catalog listed in the Burbidge Table 5.1 for which the necessary data are available. Polarization values are not given in the Burbidge work and they have therefore been taken from other sources, mainly the measurements at 21.2 cm reported by Bologna, et al,46 In view of the large variations in the polarization measurements by different investigators it has seemed advisable to have the benefit of a second set of values, and since no other measurements at the same wavelength are available, the results at 6 cm reported by Sastry, et al,47 have been averaged in with the 21.2 cm values in the following manner: The average polarization at 21.2 cm was compared to that at 6 cm for those quasars on which both measurements are available, and it was found to be 0.673 of the 6 cm average. The 6 cm values as reported were therefore reduced by the factor 0.673 and then averaged with the corresponding 21.2 cm values for purposes of Figure 12. Where no 6 cm measurement was reported, the 21.2 result was utilized without modification. This method of combining the two sets of data is based on the assumption that the radio spectra of the quasars conform to a general pattern within a reasonable margin of variation. This should be true for all but the exceptional objects, and the combination should therefore give us values which are more reliable than either set of observations individually.
Within the accuracy of the observations, the evolutionary path of the Class I quasars in this diagram, represented by the open circles, is identical with the trend of the R.F. values for these same quasars in Figure 9. In the early stages, when the U-B index is low, the effects of the forces exerted during the ejection are still very much in evidence, the polarization is consequently high, and the quasar is located in the upper left of the diagram. As it ages and the violent activity subsides, the polarization decreases, moving the quasar toward the right, and the U-B index increases, moving the quasar downward on the diagram, following the same course as the radio flux in Figure 9.
The Class II quasars, represented by the filled circles, occupy a different region of the diagram, quite distinct from the Class I region, just as they did in Figure 11. Actually two of the quasars are on the wrong side of the dividing line, but some discrepancies can be expected, in view of the uncertainties in the polarization measurements. Both of the deviant cases are in the group for which we have only the 21.2 cm measurement. As in Figure 11, the quasar 3C 273 occupies a normal position in the diagram, indicated by a triangle. This location is well away from the boundary line, where there is no doubt as to the proper classification of the quasar.
Like the previous comparison of R.F. and U-B in Figure 11, the Figure 12 diagram gives no indication of a Class II evolutionary pattern, except that the cut-off line at the right of the diagram drops sharply as it approaches zero polarization. This lack of a definite trend is quite understandable. In Class I there is a specific initial point. At the time of ejection, the violent activity is at a maximum, and as the quasar ages this activity gradually decreases, together with the visible indicators of that activity. In Class II, however, the activity is not initiated by a single event, but by a series of explosions of individual stars which extends over a very long period of time. We have seen that, aside from possible exceptions such as 3C 273, the explosions do not occur in any substantial numbers earlier than the age corresponding to a quasar distance of about 0.800, but they can begin at any later time. The radiation from the Class II quasars therefore consists of a mixture of components of different ages.
It is possible, nevertheless, to arrive at some conclusions about the evolution of these objects on the basis of the theoretical deductions that have been verified in application to other phenomena, including the Class I quasars. The polarization, as we have seen, is an indication of the amount of violent activity, and for the Class II quasars a relatively high polarization means that the large-scale series of stellar explosions which raises the quasar from the radio-quiet to the Class II status has only recently begun. We may therefore distinguish the recent arrivals in Class II from those of longer standing by their higher polarization. Inasmuch as the Class II quasars do not make their appearance at all (with the usual exception of 3C 273) before a quasar distance of about 0.800, we can expect that the distance range immediately above 0.800 will contain a preponderance of quite recent entries into Class II. This expectation is borne out by the fact that three of the four quasars below a distance of 0.900 have polarizations well above the average for the total group included in the study, and the quasar with the shortest distance also has the highest polarization. However, the quasar 3C 186 at distance 0.984 almost equals this maximum, indicating that here, too, the onset of the secondary explosions is quite recent, and there is still another quasar in this group that has a polarization above average and is located as far out as 1.272. This evidence suggests that for the quasar population as a whole the secondary explosions are a continuing phenomenon throughout the entire range beyond quasar distance 0.800.
Such a conclusion is completely in accord with the theory, inasmuch as the growth process of the galaxies results in a continuous distribution of stellar ages from the oldest downward. As soon as the oldest of the constituent stars of a galaxy or a galactic fragment (aside from a few survivors of previous explosive events) arrives at the destructive limit a regular succession of explosions follows. We may also corroborate this conclusion observationally by examining the relation between the quasar distance and the magnitude of the radio flux. We have already found that the average age of the quasars increases with distance. If the explosions persist throughout the range

of distances of the Class II quasars then there should be a gradual build-up of energy, and the average output of radiation from these objects should increase with distance rather than remaining constant in the manner of the Class I quasars. Figure 13 shows that such an increase actually takes place in the radio flux from the 3C quasars listed in the Burbidge Table 5.1. There is a range of variation at each distance, as would be expected, but the minimum R.F. more than doubles between 0.800 and 2.000, and the maximum value increases in an almost parallel line.
With these findings as to the nature of the developments during the life period of the Class II quasars, we have now completed the task of tracing the progress of the quasars from the time they are ejected from the galaxy of origin to the time that they acquire unit speed in the two inactive dimensions and disappear into the region of motion in time. In order to place the quasar in its proper perspective, however, it should be emphasized that the existence of this object is not an isolated phenomenon—something that may happen under some special conditions—it is a segment of the great cycle of physical existence, something that eventually happens, in one way or another, to all matter. The quasar state is an integral part of the physical cycle; it is the connecting link between the old in the material sector of the universe and the new in the inverse, or cosmic, sector.